Time is often considered to be a subjective experience—it seems to pass quickly or it drags on and on. Structuring time with timelines, however, provides a sense of stability and objectivity. It’s a way to give temporal events a framework so we can show how occurrences relate to each other. Essentially, timelines provide a way to tell a story.
Elements of Timeline Language
To understand a graphical timeline, the viewer needs to understand both its conventional and novel visual language. Timelines typically have a minimum of four visual elements:
- A way to depict the trajectory or path of time (conventionally, these run left to right or top to bottom)
- Elements that define each point or segment of time (often a line or shape)
- Elements that define each event (text and/or graphic)
- Text labels and call-outs (used on the trajectory and elsewhere)
Timeline Examples
As visualizations grow in popularity, timelines use ever more creative visual language to communicate through shape, color, movement and imagery. Whether traditional or unique, each one has a distinctive message. Interestingly, some of these examples are quite demanding and require serious study. If you’re thinking of creating a timeline, you’re bound to find some inspiration here. If you’re an observer, I hope you enjoy the variety.
3D Spiral Timeline
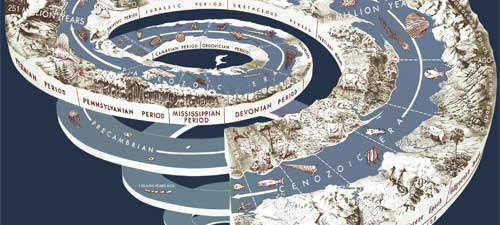
You often find three-dimensional spirals or circular formats representing geological time. Perhaps it is too grand a concept for the horizontal arrow. The spiral form seems ideal for portraying sweeping periods of time, because it tapers off into the void. In this example, illustrations add to the fantastic form because they communicate so much more than a text label alone. This is worth viewing in the largest size possible—keep clicking!
Highly Interactive Timeline
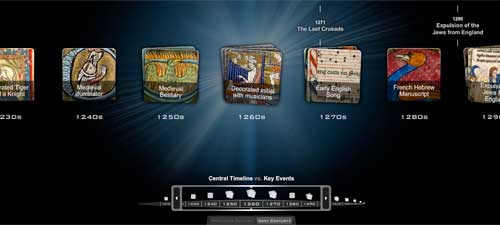
This exquisite timeline displays sources from western history gleaned from the British Library. Users select a timeline at the top of the display and then control the time period through a wheel interface at the bottom. For larger leaps through centuries, there are next and back buttons. Unlike most timelines, the path of time is not explicitly depicted, but emerges out of the horizontal layout. Selecting an image card provides access to further information on the back of the card.
Game Board Timeline
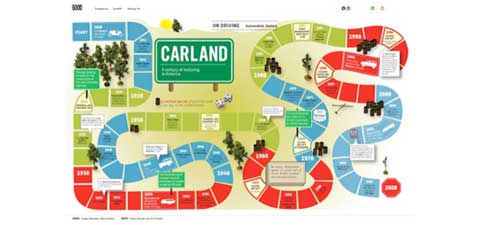
This timeline covering the history of automobiles, driving and fuel, uses the visual language of a game board. According to one of the designers, Colleen Corcoran, “It was sort of ironic to use the analogy of the Game of Life to talk about something that’s had such a huge effect on our environment and our culture.” In this novel approach, decades are distinguished through color; events are placed on “squares” of the board; and sign posts function as call-outs for additional explanations. The timeline is embellished with iconic art and photographed objects.
Chaotic Timeline
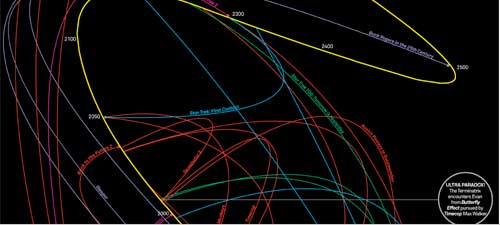
This timeline with a spacey feel represents all the time travel plots from TV and film. With a time span ranging from 1184 BC to 3978 AD, it was difficult to squeeze everything into neat and uniform paths. Instead, curvy and chaotic lines took over as the trajectories of time, with color representing the method of time travel (blue is Alien Technology) and call-outs that only a sci-fi buff would understand. Read David McCandless’ design process here.
Relationship Timeline
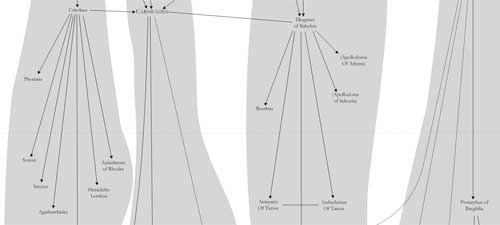
When you come upon the minimized version of the Timeline of Western Philosophy (Part 1), the most compelling feature is the use of organic shapes. Click and magnify it to see that relationships between philosophers are a key focus and are identified by four different styles of arrows. The organic shapes portray the time span for which schools of thought existed. A key in the upper right helps with the wayfinding of this exceedingly long vertical timeline.
Granular Timeline
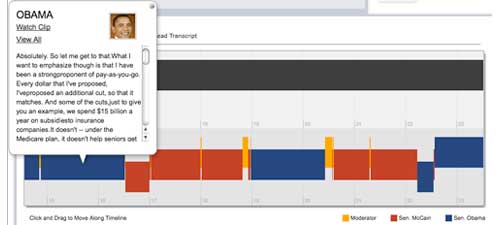
Some timelines focus on the granular aspects of an event, as you’ll find in this timeline depicting a minute-by-minute account of the 2008 US national election debates. C-Span designers approached the concept with a double timeline. The upper one represents the topic at hand; the lower timeline represents the time spent an individual speaker spends on each topic. Rectangular shapes depict each speaking event; color represents the candidate or moderator; and a simple reference key explains the color code. Note that the timeline includes layers of information. Upon selecting each event block, a call-out displays the transcript and provides links to a corresponding video clip. [Sorry, C-Span no longer has this interactive timeline available.- CM]
Mixed Infographic Timeline
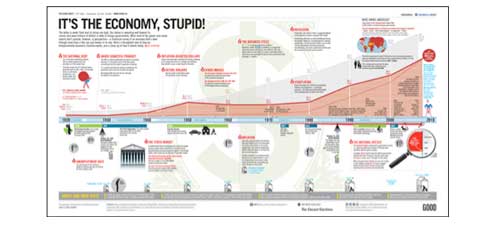 Timelines provide a framework for integrating other types of abstract graphics, like the trend graph shown here. A mix of formats allows the designer to add a new dimension of related information to the timeline, though it takes longer for the reader to discriminate between graphical types. Adding illustrations or icons to a timeline can help or hinder the communication, depending on whether it adds to the message or distracts from it.
List Timeline
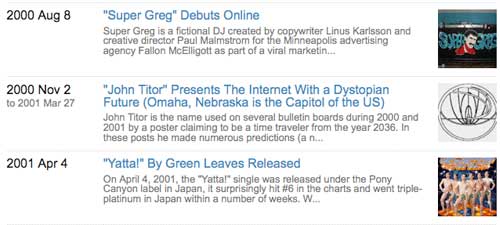
More often than not, text-based timelines are arranged in a vertical format that are read from top to bottom. With the popularity of Twitter, a time-based list of events accompanied by a thumbnail image has become a familiar approach. Although not visually striking, this format has effective information design, is usable, and is fairly easy to produce. This example—Timeline of Internet Memes—also includes a second layer of information accessed by clicking on the title or graphic.
You might also like to read:
Information Display Tips
Guidelines For Designing Tables
If you have a timeline to share, link to it below in Comments.
{ 3 trackbacks }
{ 3 comments… read them below or add one }
Timelines not only add structure, but can also be used to manipulate perceptions of time. When I was in grad school we used timelines in the psych lab to manipulate the subjective temporal distance of past events by changing the anchors at either end of the line. Study participants would draw an “X” on the timeline to indicate when an event happened. Depending on the anchor used at the beginning of the line, the X would either be very close to the right boundary (today) or more distant.
Birth———————x-Today
Start of term———-x————-Today
By framing the event in this way, we were able to make the event feel more or less distant. Interestingly, events that felt more distant also seemed to have less impact on self-perceptions. For example, people will feel worse about a negative event if it also feels subjectively recent, regardless of how much time has actually passed.
Thanks for adding the dimension of time perception to the discussion, Travis. Very interesting.
Here’s a nice visual timeline used in a project management tool:
http://www.targetprocess.com/agileproductblog/wp-content/uploads/2012/02/flow.jpg
It shows an overall progress for a user story, with all the state changes, time spent, responsible persons, impediments, added and closed bugs, and tasks. It helps to discover problems and waste in Kanban.